
Dead Data Walking: Are Stale Analytics Killing Your Business?
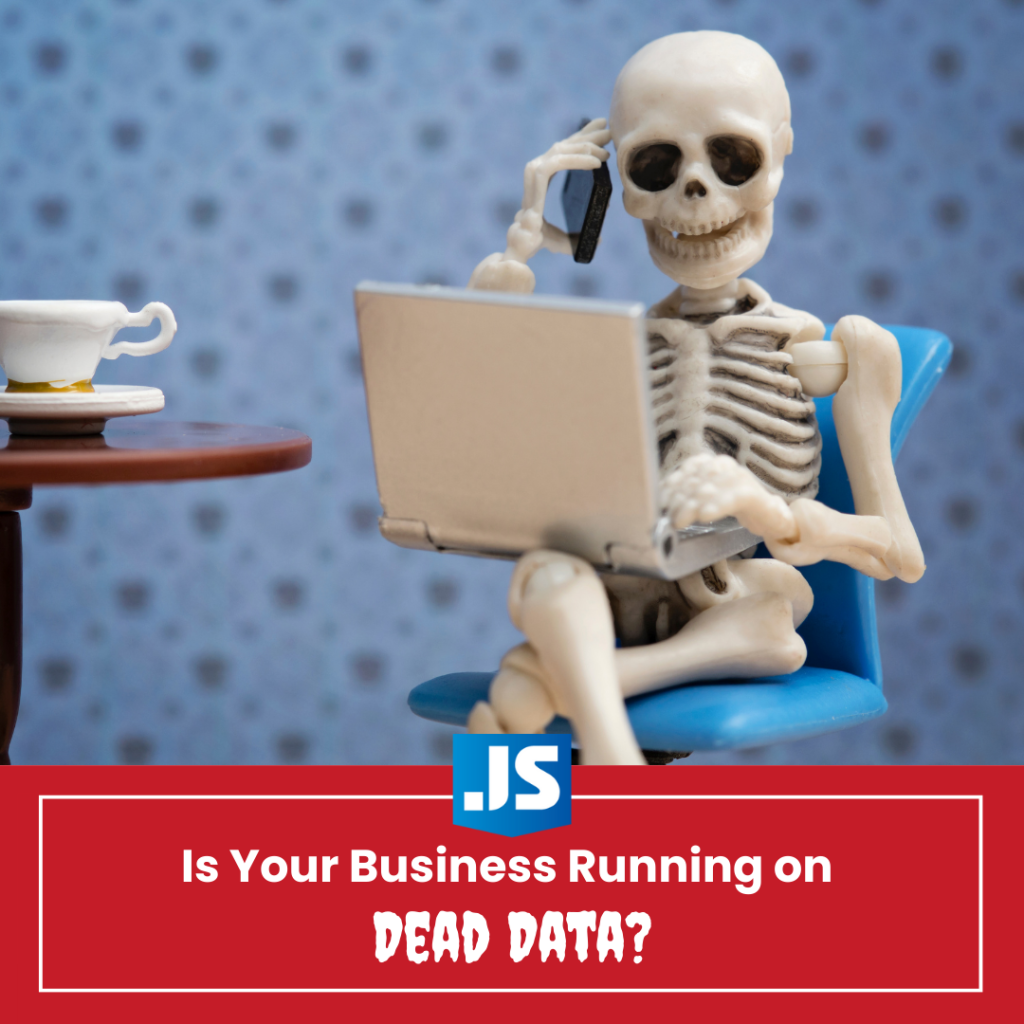
A Guide to Data-Driven Decision Making
Most business owners think they’re making data-driven decisions. Here’s a horror story that’ll freeze your blood: Right now, while you’re reading this, your business is probably running on zombie data—stale, outdated information that’s no longer relevant but still driving your decisions. Worse, you don’t even know it’s killing your business.
I’ve spent 20 years performing financial forensics on companies teetering on the brink of failure, and here’s the terrifying truth: they all had one thing in common – they thought they were data-driven, but they were actually driving blind with zombie data as their GPS. Modern business requires real-time data analytics to inform business decisions effectively.
Want to know what absolute terror looks like?
It’s not monsters or ghosts – it’s watching $283,000 in profits vanish because you used historical data based on last quarter’s numbers to make decisions about your business’s future.
To make matters worse, in addition to the lost profits, while you were analysing outdated analytics reports, your competitors were feasting on your market share with their real-time analytics.
Fair warning: If you’re looking for gentle suggestions and corporate buzzwords about “data-driven decision-making,” stop reading now. This is about keeping your business alive, and I don’t sugarcoat terminal illness.
The Business Analytics Horror Show: Data-Driven Decision-Making Nightmares
Welcome to your personal business horror show. Each of these scenarios might be happening in your business right now – you just don’t know it yet. Ready to face your fears? Let’s peek behind the curtain of your data nightmares…
🔪 “Nightmare on Excel Street”
Picture this: You’re confidently running your business based on last quarter’s numbers. But there’s a killer lurking in your spreadsheets.
The truth emerges in bloody red numbers: your actual costs are 15% higher than you think. That innocent-looking gap multiplies across your entire operation, silently draining $47,000 from your bottom line before you even realise you’re being attacked.
Meanwhile, your competitors, armed with real-time data analytics, watch from safety as you become another statistic in the data-driven decision-making massacre.
The scary truth: Your spreadsheet errors aren’t just typos—they’re $47,000 vampires sucking your profits dry while your competitors use data analytics to drive stakes through their own mistakes.
Survival tip: Implement automated data validation and real-time cost tracking to catch these budget-killers before they multiply.
🏦 “The Cash Flow Conjuring”
Think your inventory management is fine because it worked last year?
Here’s where the horror begins.
Right now, $180,000 of your working capital could be trapped motionless in your storage, like a financial vampire sucking your cash flow dry. That’s not just trapped money – it’s also costing you an additional $3,000 per month in warehouse space, slowly strangling your business. At the same time, your competitors have real-time data analytics to help them maintain optimal stock levels, freeing up their cash to invest in expanding their business.
The scary truth: That $180,000 in “safety stock” isn’t inventory management—it’s a financial horror show where real-time data-driven decision making could be your only exorcist.
Survival tip: Implement dynamic inventory forecasting, which adjusts stock levels based on real-time sales data and seasonal patterns.
💀 “The Price is Fright”
Remember those rates you locked in for your long-term clients?
They’re about to come back and haunt you.
Your operational costs have skyrocketed, but those old pricing agreements are murdering your bottom line. Every invoice you send is like a money-eating monster, devouring your margins. You might be losing $150 per transaction, but the fear of losing loyal clients keeps you awake at night, frozen in a catch-22:
Do you raise rates and risk losing your clients? Or keep them where they are and risk losing your business?
The scary truth: While you’re haunted by pricing decisions, your competitors sleep soundly because they use customer data to make informed decisions instead of gut feelings—and their profit margins aren’t the victim in this slasher film.
Survival tip: Create value-based pricing models with built-in adjustment mechanisms tied to your actual costs, and use customer data to identify which clients will accept necessary increases.
🎃 “The Customer Experience Chainsaw Massacre”
Here’s a real nightmare scenario: You think your customers are happy because your annual survey says so. But what’s really happening out there?
By the time your quarterly reports show a problem, you could have already lost 30% of your customer base. The cost of relying on outdated customer feedback? It could be upwards of $500,000 in lost revenue and a reputation that takes years to rebuild.
The scary truth: By the time your quarterly report reveals a customer exodus, the massacre’s already happened. Real-time data analysis isn’t just business strategy—it’s your only defence against a half-million-dollar bloodbath.
Survival tip: Implement continuous feedback mechanisms including post-transaction surveys, social media monitoring, and customer experience metrics that alert you to problems within hours, not months.
🧟 “Night of the Living Dead Data”
Want to hear something truly terrifying? Most business decisions are based on zombie data – numbers that are dead but still prowling around eating your profits.
Think about it:
Are you making inventory decisions based on last year’s trends? Planning staffing based on outdated patterns?
The scary truth: Your zombie data is making a meal of your business while your competitors use fresh analytics to guide strategic decisions. The real horror? You’re the one who keeps feeding it.
Survival tip: Implement a data freshness policy that automatically flags and quarantines outdated information, and build decision-making processes that prioritise current data over historical trends.
Signs You Could Be Sipping on Stale Data Point Poison: Why Data-Driven Decision Making Is Important
Wondering if your business might be infected? Here are the warning signs of zombie data:
Historical Hindsight
- Your reports always look backwards, never forward
- All analysis focuses on what happened, not what’s happening now
Time-Lagged Decisions
- You make decisions based on quarterly averages
- Your “real-time” dashboard is actually days or weeks behind
Operational Rigidity
- You can’t adjust prices or inventory on the fly
- System updates require IT intervention and take weeks
Customer Blindness
- Customer feedback takes weeks to reach decision-makers
- You learn about problems from reviews, not your systems
Each of these symptoms indicates your business is running on zombie data – information that looks alive but is actually dead and decaying.
The Frightening Truth About Data-Driven Decision Making
Having a fancy dashboard full of metrics doesn’t make you data-driven – it makes you a hoarder of dead numbers.
Here’s what real data-driven decision-making looks like:
- Real-time analytics tracking current performance
- Business intelligence tools that alert you to changes immediately
- Data visualisation that shows you trends as they happen
- Actionable insights you can implement today, not next quarter
- Data analytics that transform raw data into strategic decisions
Want to know if you’re really using data effectively?
Answer these questions:
- Can you tell me your exact profit margins from last week?
- Do you know which products are trending up or down RIGHT NOW?
- Can you spot customer experience issues before they show up in your reviews?
If you answered “no” to any of these, you’re not making data-driven decisions – you’re making educated guesses with expired information.
Your Data-Driven Survival Guide: Implementing Data-Driven Strategies
Ready to stop the horror show? Here’s your survival kit for implementing data-driven decision-making that actually works:
1. Kill Your Zombies (Dead Data)
- Identify all your data sources for better data collection
- Establish real-time data collection processes
- Create automated reporting systems to analyse data
- Set up alerts for key metrics and business goals
- Implement continuous data quality monitoring for big data
2. Build Your Arsenal (Analytics Tools)
- Implement business analytics software to make informed decisions
- Set up data visualisation dashboards for strategic decisions
- Create a centralised data management system for all business data
- Install real-time monitoring tools to improve customer experience
- Deploy predictive analytics capabilities to drive business growth
3. Train Your Survivors (Team Development)
- Establish a data-driven culture across your organisation
- Train team members in data analysis and data science techniques
- Create clear decision-making processes based on data
- Set up regular data review meetings to make better decisions
- Develop data literacy across departments to use data effectively
Your Early Warning System: Using Data to Determine Your Next Move
Here’s exactly what you need to monitor and how often:
Daily Vital Signs: How to Use Data to Determine Your Next Move
| Metric | What to Track | Why It Matters |
| Cash Position | Bank balances across all accounts | Prevents cash flow surprises |
| Sales Pipeline | New leads, quotes sent, deals closing | Predicts revenue accurately |
| Operational Costs | Labour hours, material usage, direct expenses | Catches cost blowouts early |
| Customer Issues | Complaints, service delays, quality concerns | Prevents small problems from becoming expensive |
Weekly Data Analytics Check-In
| Metric | What to Track | Why It Matters |
| Profit Margins | Margins by product/service line | Identifies profitable vs. problematic areas |
| Accounts Receivable | Aging report, overdue payments | Prevents cash flow strangulation |
| Labour Efficiency | Billable hours vs. total hours | Spots productivity issues |
| Marketing ROI | Cost per lead, conversion rates | Ensures marketing spend effectiveness |
Monthly Investigation – A Deep Dive Into Data Analysis
| Metric | What to Track | Why It Matters |
| Fixed Costs | Rent, salaries, subscriptions, loans | Prevents overhead creep |
| Client Retention | Repeat business rate, client lifetime value | Shows business health |
| Inventory Levels | Stock turnover, dead stock value | Prevents cash being tied up |
| Employee Performance | Productivity metrics, billable ratios | Identifies training needs |
Quarterly Survival Check List for Data-Driven Decision Making
| Metric | What to Track | Why It Matters |
| Market Position | Competitor pricing, market share | Keeps you competitive |
| Growth Trends | Revenue growth rate, profit growth | Shows business trajectory |
| Client Mix | Revenue concentration, client profitability | Prevents dangerous dependencies |
| Process Efficiency | Operating costs vs. revenue | Identifies automation needs |
Code Red Metrics: Urgent Actionable Insights to Look Out For
- Cash runway less than 60 days
- Gross margin below 30%
- Accounts receivable over 45 days
- Customer complaints increasing week over week
- Employee overtime exceeding 20%
- Project delays beyond 10% of estimated time
Pro Tips to Become More Data-Driven:
- Start with the daily metrics – they give you the fastest feedback
- Set up automated alerts for your code-red metrics
- Create a dashboard that shows these numbers in real-time
- Review this data at the same time each day/week
- Share relevant metrics with your team leads
Remember: These aren’t just numbers – they’re early warning systems for your business. Ignore them at your peril.
Real-Time Data Decision Making: Examples of Data-Driven Success Stories
Not all horror stories end in disaster. Here are some businesses that escaped the data graveyard by implementing data-driven strategies and using customer data to inform business decisions:
The Commercial Plumber’s Comeback
A commercial plumber went from struggling to soaring by implementing proper data-driven strategies:
- Boosted revenue by 42.8% (from $1.68M to $2.4M)
- Skyrocketed profits by 272% (from $105,000 to $393,700)
- Achieved these results in just 20 months
The Staircase Manufacturer’s Success Story
A staircase manufacturer turned their business around completely within 5 years:
- Increased revenue by 131.6% (from $1.58M to $3.65M)
- Exploded profits by 415.4% (from $175K to $902K)
- Built sustainable systems for long-term growth
The Commercial Road Grader’s Growth Story
This commercial road grader operator achieved stunning results in just 12 months:
- Grew revenue by 396% (from $705K to $3.475M)
- Increased profits by 423.1% (from $194,000 to $823,000)
- Transformed their entire business model for sustainability
The Arborist’s Amazing Turnaround
A commercial arborist business moved from loss to major profit in 1 year:
- Lifted revenue by 147% (from $829K to $1.220M)
- Turned around profits by 507% (from $-13,500 to $375,620)
- Built systems for consistent growth
A Workforce Development and Training Company’s Transformation
In a major industry downturn, this business:
- Achieved $1.5M turnover in the following fiscal year
- Reduced administrative hours significantly
- Implemented new technologies and efficiencies
- Created better business systems across the board
A Final Warning: Embrace a Real-Time Data-Driven Approach or Risk Business Failure
The business graveyard is full of companies that thought they were making informed decisions based on data. Don’t join them.
Your competition isn’t just using data – they’re living it. Every decision, every strategy, every move they make is backed by real-time analytics and actionable insights. The process of using data to guide business decisions is no longer optional—it’s essential for business success in today’s data-driven world.
A Case for Why You Need Real-Time Data to Make Better Business Decisions
Warning: These statistics on the cost of inaccurate and poor-quality data will keep you up at night.
- Companies lose an average of 15% to 25% of their revenue due to inaccurate data, which includes wasted marketing spend, resources, and staff time (MIT Sloan)
- IBM estimates that U.S. businesses lose approximately $3.1 trillion each year due to poor data quality (Harvard Business Review)
- According to Forbes Insights, 66% of executives believe that inaccurate data undermines their ability to provide an excellent customer experience (H2K Labs)
The benefits of data-driven decision-making
These numbers may keep you up at night too⏤but from excitement instead of fear!
- According to a report by McKinsey, companies leveraging real-time analytics are 23 times more likely to acquire customers and 19 times more likely to be profitable
- A study by Deloitte found that organisations utilising live data insights can improve their decision-making speed by up to 30% (Pisco-Smart)
- Experian’s 2022 report found that improving data quality enabled 75% of businesses to exceed their objectives (Experian)
Take The Zombie Data Self-Assessment Quiz: How to Become More Data-Driven
How badly is your business infected with zombie data? Answer these 10 questions honestly to discover your risk level:
- When was the last time you updated your pricing strategy?
- A) Within the last month
- B) Within the last quarter
- C) Within the last year
- D) Over a year ago or I can’t remember
- How quickly can you see the impact of a marketing campaign?
- A) In real-time
- B) Within a day
- C) Within a week
- D) After several weeks or months
- How often do financial reports get generated for your business?
- A) Daily updates with real-time dashboards
- B) Weekly comprehensive reviews
- C) Monthly summaries
- D) Quarterly or annual reviews
- When a customer complains, how quickly is that information available to decision-makers?
- A) Immediately
- B) Within hours
- C) Within days
- D) It depends on who receives the complaint
- How do you track inventory levels?
- A) Real-time automated system
- B) Daily manual counts
- C) Weekly reviews
- D) When we run out or during scheduled audits
- How do you make staffing decisions?
- A) Based on real-time demand metrics and forecasting
- B) Weekly planning based on recent trends
- C) Monthly scheduling based on historical patterns
- D) Fixed schedules with occasional adjustments
- When costs change from suppliers, how quickly do you adjust your pricing?
- A) Automatically with real-time adjustments
- B) Within days
- C) Within weeks
- D) During scheduled reviews (monthly/quarterly)
- How do you track employee productivity?
- A) Real-time metrics with immediate feedback
- B) Daily or weekly reviews
- C) Monthly performance discussions
- D) Annual reviews or when problems arise
- How do you determine which products/services are most profitable?
- A) Continuous monitoring with real-time margin calculations
- B) Weekly profit analysis
- C) Monthly or quarterly reviews
- D) Annual assessments or gut feeling
- When making strategic decisions, what timeframe of data do you typically rely on?
- A) Current data from the last 24-48 hours
- B) Last 7-14 days
- C) Last 1-3 months
- D) Last 6-12 months
Scoring:
- Mostly A’s: Minimal Infection – Your business has a strong data-driven foundation, but there’s always room for improvement.
- Mostly B’s: Moderate Infection – You’re on the right track, but zombie data is still lurking in some critical areas.
- Mostly C’s: Severe Infection – Your business decisions are significantly hampered by outdated information.
- Mostly D’s: Critical Infection – Your business is running almost entirely on zombie data. Immediate intervention required!
Ready to stop the horror show and become a data-driven business success?
Here’s what to do:
- Book a free ‘Make it Happen’ call with me
- Get a clear assessment of your current situation
- Receive a custom implementation plan for The Profit Oxygen Formula—a data-driven approach to business growth
Remember: In modern business, the only thing scarier than making decisions with bad data is making decisions with dead data. Using data to make informed decisions is what separates thriving businesses from those that struggle to survive.
Don’t wait until it’s too late. Your business’s survival depends on it.
Book Your Make it Happen Call Now
Limited spots available
About the Author: John Stringer is a no-BS business performance specialist with over 20 years of experience helping businesses achieve up to 423% profit increases through data-driven strategies. Working with business owners across Australia, the US, and UK, John has a knack for turning struggling businesses into profit-generating machines by implementing data-driven decision-making processes that align with business goals.